Best Of
The 2026 Leapfrog Geo Mastery Series is kicking off soon!
Ready to move beyond the basics and master Leapfrog Geo?
Led by masters from around the globe, our Leapfrog Geo Mastery Series will empower you with:
- In-depth knowledge: Learn advanced workflows for maximum efficiency.
- Practical insights: Follow step-by-step guides you can apply to your own projects.
- Skill currency: Master the skills that are in high demand in your field.
This series is perfect for Leapfrog Geo users who have established foundational skills but are looking to elevate their expertise and become more confident and efficient.
Check out the first session for 2026, kicking off in early February; The resource revealed: Advanced data presentation in Leapfrog Geo.
Register now
We'll also be collaborating with participants in the series over on the Mastery Series Group, so join us there too:

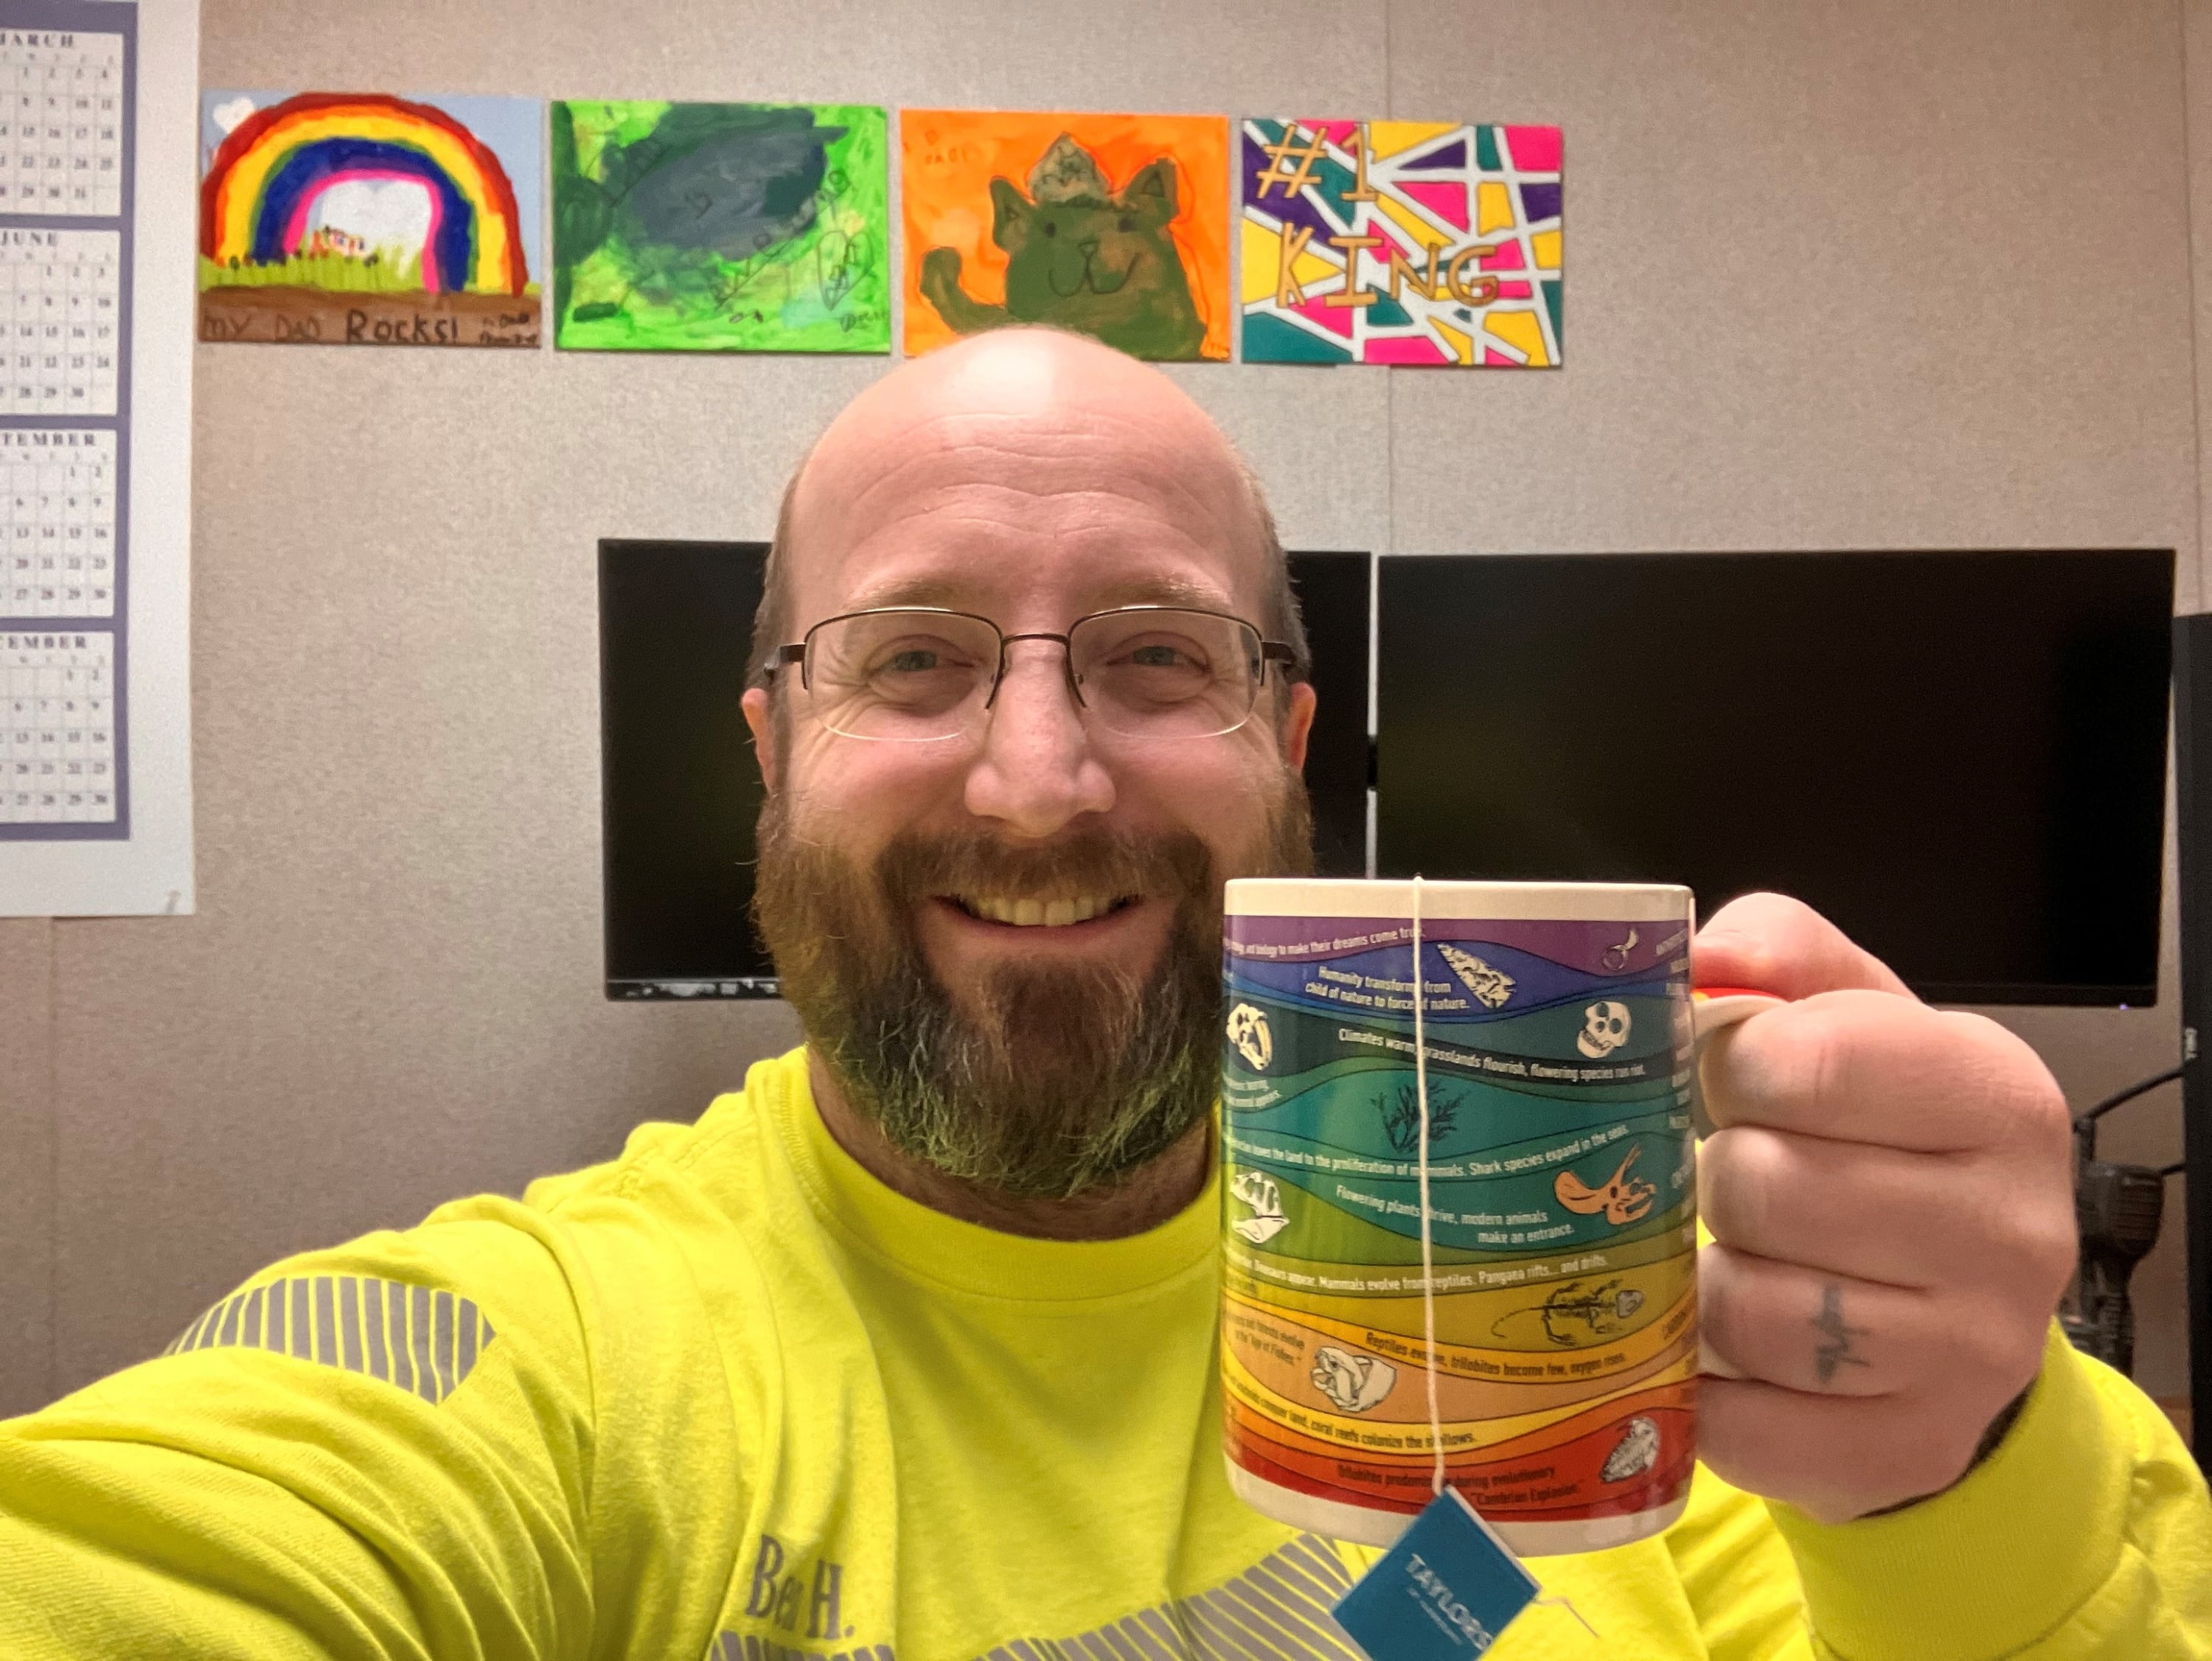
📣 Member Spotlight: Meet Ben (Hecla Mining)
We’re kicking off a new Monthly Member Spotlight to highlight the people and projects that make this community what it is.
This month, we’re spotlighting @BenHenderson, a community member working as a Senior Geologist at Hecla Mining’s Lucky Friday mine in Idaho.
What he works on
Designing and executing diamond drilling programs and building geological models in a mining district with over 140 years of mining history.
Tools he uses
Leapfrog Geo - for geological modeling and data visualization, and for bringing exploration data together in context.
What he finds most interesting
Combining historic datasets with modern geological understanding, especially when working through complex structural geology shaped by generations of geologists.
A tip for fellow community members
Use Leapfrog beyond traditional geology. Visualizing engineering, geotechnical, or operational datasets in 3D can uncover insights that aren’t always obvious and can improve collaboration across mine-site teams.
What sparked his interest in geoscience
A Geology 101 lecture on magmatic differentiation that captured his curiosity and led him into mining.
Fun fact
Ben enjoys listening to 1940s swing music.
💬 New here or been around a while? Say hello, introduce yourself, and let the community know what you’re working on.

Leapfrog 2025.3 is live!
Hello Leapfrog Community 🎉🐸
I’m excited to share with you today the link to the latest version of Leapfrog Geo, Leapfrog Works, and Leapfrog Energy. The latest release improves efficiency and gives you greater control across data analysis and modelling workflows.
In this version, you’ll find:
🔹Refined geostatistical analysis: Save graphs and tables, and filter swath plots by domain or set coordinate limits
🔹Contextual core imagery: Stream Imago core photos directly in the drillhole correlation tab, with automatic unit conversion
🔹Revamped structural toolkit: Fine-tune clustering settings in downstream models, and enjoy a new interface layout and display filtering in stereonets
🔹Better site presentation with strip view: Add strip views to long sections with enhanced section line controls and chainage alignment
🔹 Enhanced borehole planning experience: Plan, visualize, and communicate more easily using end-of-hole labels and depth markers, as well as faster model evaluations and export filters
I’ll be keen to hear what you think of the new version! Click here to check it out.

Thank You for a Wonderful Year in the Seequent Community
As we head into the holiday season, I wanted to take a moment to acknowledge the collaboration, curiosity, and knowledge-sharing that shaped the Seequent Community this year.
Thank you to everyone who contributed, shared insights, supported a peer, or simply checked in from time to time. Looking forward to everything we’ll continue building together in 2026.
Wishing you all a restful break and a smooth start to the new year!

💥 Exciting Updates in Visible Geology!
We’re thrilled to announce some powerful new features designed to make your geological modelling experience more intuitive, efficient, and visually clear.
👀 Plus, Google account login for Visible Geology is coming soon! Keep an eye out for more information.
Here’s what’s new:
👉🏼 Edit custom topography
No more starting from scratch! You can now reshape, refine, and adjust existing custom topographies directly within Visible Geology.
👉🏼 Import stereonet data
Save time by instantly importing planar or linear data from spreadsheets or text files - no more manual entry!
👉🏼 Create topography from contour lines
Gain full control over your topographies by using contour lines and elevation data to create precise models.
👉🏼 Lithology legend display
Easily view the lithologies in your models with a new dynamic legend. As you model, the legend updates!
👉🏼 Stereonet rose plot
Generate, view and export intuitive rose plots from your existing project data to visualise structural patterns.
👉🏼 Stereonet toggle for poles and planes
The new toggle feature lets you show or hide poles and planes in the Stereonet view, keeping your diagrams clean and focused.
👉🏼 Set colours for assignments
It's now easier to differentiate and organise multiple assignments visually with custom colours.
Shown above: Importing stereonet data
We’ve also resolved some pesky bugs to make your experience smoother, including:
- Plunge fold behaviour bug fixed
- Unity upgrade implemented
- Stereonet auto-naming vs parameter confusion resolved
- Zoom speed adjusted for better control
- Decals no longer cross models
Ready to explore these improvements? Visit www.visiblegeology.com, log in to Visible Geology and experience the updates today!

Re: Creating a classic strike-dip symbol in Plan View Layout
If you already have a fault line:
- In the Structural Modeling Foder, select New Structural Data Point ( https://help.seequent.com/Geo/2024.1/en-GB/Content/structural-data/structural-data.htm#new-structural-data )


2. In the Plane View, navigate to the Structural Data folder, add a new Structural Data item, and configure it as shown in the image below.

I hope this information is helpful for your work!😊

Seequent Learning at EGU 2025 in Vienna
To stay abreast of current developments in geoscience, Seequent Learning geoscientists often attend international conferences and workshops. I attended the European Geosciences Union annual meeting in Vienna in April and participated in session on geoscience for the energy transition and energy storage.
Having subject matter experts go to conferences and workshops is one of the ways that Seequent helps ensure that its training content is up-to-date with the latest industry and academic knowledge and trends.

🚀 What's new in Visible Geology - May 2025
We are excited to announce that several enhancements have been made to Visible Geology to make your modelling even smoother!
Try them for yourself at www.visiblegeology.com, and let us know what you think in the comments below 👇️
- You can now bring more colour to your geological models by using the colour picker for dikes, plutons, and faults;
- When creating cores, you can now enter trend and plunge values in a data field and name your creation instead of using a default name;
- We've added directions on the grid so you can better locate yourself when using Visible Geology;
- Across Visible Geology, we've made efforts to match worldwide notation standards, displaying strike, rake, and trend with three digits;
- Lastly, in the Stereonet tool, you can now cancel your action upon creating a stereonet projection, avoiding the need to save and then delete it.
Plus, we've addressed some pesky issues you may have encountered:
- Contour lines have been enhanced for better visibility on topography and we've removed the straight lines that were incorrectly linking topography lines;
- Sections rendering will now appear correctly on complex geological models, regardless of their azimuth.
As always, we appreciate the support and feedback from the Visible Geology community!

 HollyChapman
New to GeoStudio? Get Started with the GeoStudio 2D Course from Seequent Learning Center!
Whether you're new to geotechnical modeling or just getting started with GeoStudio, this self-paced, beginner-friendly course is the perfect entry point. Offered through the Seequent Learning Center, the GeoStudio 2D course provides a hands-on introduction to the fundamentals of setting up and reviewing a 2D analysis in GeoStudio.
Here is what you will gain by the end of this course!
- Create or open GeoStudio project files
- Navigate the user interface with confidence
- Add and modify geometries and analyses
- Import geometries from past projects or DXF/DWG files
- Refine the mesh and add surface layers
- Use visualization and graphing tools for result interpretation
- Adjust print settings and work with custom printing templates
Ready to begin your learning journey! Enroll Now! ✅
Re: Edit Category Selections in Point Data
Perfect, thank you very much! This is a very good work around - all my data is safe and restored now.
One little comment: What I found a bit unclear, is, whether or not I should base my newly created category column on my orginial editable category column. I would like to precise that you must choose "<None>" for the source column, otherwise it wount work.

Thanks a lot!
Samuel