Best Of
Re: How can I join the intrusion intervals together
Glad to see it helped. Be careful with setting the clipping values though, because I have found if you are too extreme you end up with a 'pincushion' effect of the surface, where the drill hole intersections are indentations and the volume is over-estimated between holes. Filtering exterior points removes points beyond the contact buffer distance you set, so it can help a bit if you have drillholes at a low angle to the contacts. It's useful with larger data sets too because it helps reduce processing time by ignoring points.

Re: How can I join the intrusion intervals together
Xiaochen,
You can try changing the "Value clipping" function to reduce the influence of 'outside' points by setting the lower bound value closer to zero. Also applying "filter exterior points" to the points contacts can also help. After that you have to start manually adding points or polylines to force joining.
However, in your picture it looks like the feature you are trying to model as an intrusion is quite thin relative to the spacing between drill holes. Leapfrog's Intrusion modelling will always struggle to join up these sorts of intervals and in this case you are better off using Vein modelling.
Re: how can I get well defined youngest lithology on top
Hi Maria,
Try creating a new surface chronology as a deposit, using the same lithologies as your erosional chronology. Sometimes Leapfrog is too strict, and you need to choose the type of surface chronology to use depending on the result you want to achieve.
I have even sometimes had to model sedimentary units as intrusive simply because, in my tectonic context, Leapfrog was unable to reproduce the correct geometry using erosional or depositional models.
I hope it will help you.
Cheers,
François

Re: Seep/w FOS
Hi @SanjayShukla, SEEP/W doesn't calculate FOS, you need to use SLOPE/W to find the FOS. I've attached a PDF that discusses this.

Re: License renewal
Hi Gordon, for all inquiries on renewing or updating your GeoStudio license, please reach out to sales@geoslope.com. Good luck!

Re: Polyline Attributes: modifying, and using for Vein FW/HW
Hi Nathan,
The option to filter your polyline's attributes is available the first time you add it.
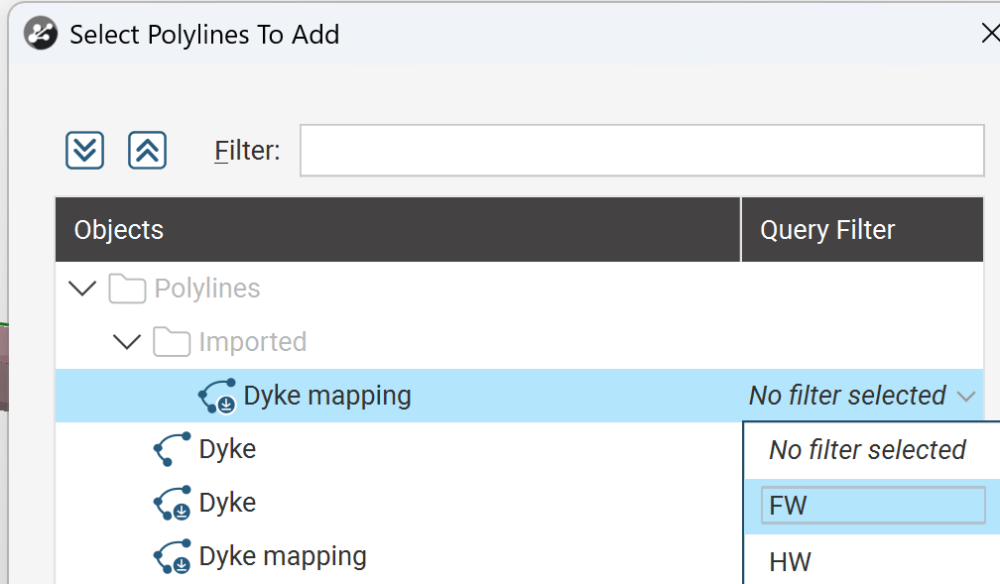
You can try removing it and adding again.
Cheers,
Amelia O.
Visualizing ground inclinometer data (horizontal displacement & azimuth)
Dear LP community,
recently working on a tunnelling project, we need to visualize ground inclinometer's data directly on a 3D model. I know that inclinometric ground horizontal displacements can be uploaded as "numeric data" when importing boreholes (i.e. you can attach horizontal displacements and direction of displacement - azimuth - together with the rest of BH data). It would be good if these data could be visualized as a bar graph (similarly to an SPT graph), but taking into account both the magnitude (displacement) and the azimuth (direction of displacement). Similarly to the attached graphic (IA generated).
Could it be added as a new functionality in future upgrades?
Many thanks!


Thrurst/reverse faults in Geo...

Re: Best practice for handling multiple “point-level” tables (Field Mapping, ESG, Prospectors) under the
Typically this is where you would configure separate activities for each logical dataset. So set up your "Field Mapping" activity as you need it, with header and sample table (allowing multiple rows), then you can set up separate "Prospecting" and "ESG" activities to those data requirements. An activity can even be just a header and you can capture everything in the header. Otherwise you can set up every activity for the specific data requirements of each. Then you can either import data into the respective activity, or if logging directly into the system - when you click "New Point" you just need to choose which activity you are creating a point for.
One consideration when planning out the activities is if you can re-use the same tables in different activities then it unlocks the ability to export data from different activities in the same export file. In the export template, these are the "common tables". You can re-use headers across activities, re-use lists across header fields and table columns - lots of ways to standardize. Otherwise, you can always configure an export template to pull the data together (if that's what you want) - or you can export each activity into separate files as well, again depends on how you want to use the data downstream.
In terms of assay results (if needed), you can even capture samples across different activities and import a single certificate that has samples spanning those activities. The system will find them, based on the sample IDs.
Lots of options, and its always good to think about how you want to pull the data out as that might influence how you configure things in the first place.
Let me know if you have any follow up questions on anything.
Re: Offline work mode login
Hi Amaraa - you can definitely log in to the mobile app while in offline mode. The only precondition is that the user must have signed in at least once on that device while it was online, so that the mobile app has a record of that users email. When the app is in offline mode, you would click the "Sign in with Seequent ID" button as usual - but at that point, it will not direct you to the Seequent ID login page because that page is not accessible without Internet. Instead - the app will present an offline login page where you can enter your email and password. Then as long as you enter an email that has signed in previously (i.e. not a new user signing in for the first time) then it will let you in. Also remember that only assigned out drill holes will be available in offline mode, as that data has been downloaded to the device. The scenario you have described is supported by the app - so if it isn't working please reach out to Seequent support (support@seequent.com) and we can investigate.