Zoned Vein Modelling Challenge: make the best model you can!


Here’s the deal: build a geological model including zoned veins using one of the three workflows discussed during the Mastery Series Session 3 webinar (going live today).
And if there’s a workflow that you use that I didn’t cover (because I probably don’t know about it), please use that and describe how you did it!
Here’s how you can participate in the challenge:
- Grab the demo data here: Veins Project
- Create a new project in Leapfrog Geo
- Create your base geological model: Mine was already built for the webinar, but you can follow the steps online in the Vein Modelling course
- Segregate the low- and high-grade parts of the veins, and use them as a springboard to build your zoned veins
- Show us what you can do: Post screenshots and, if you like, a description of your work on this thread
Seequent swag to be given to the first 20 people who post!
Comments
-
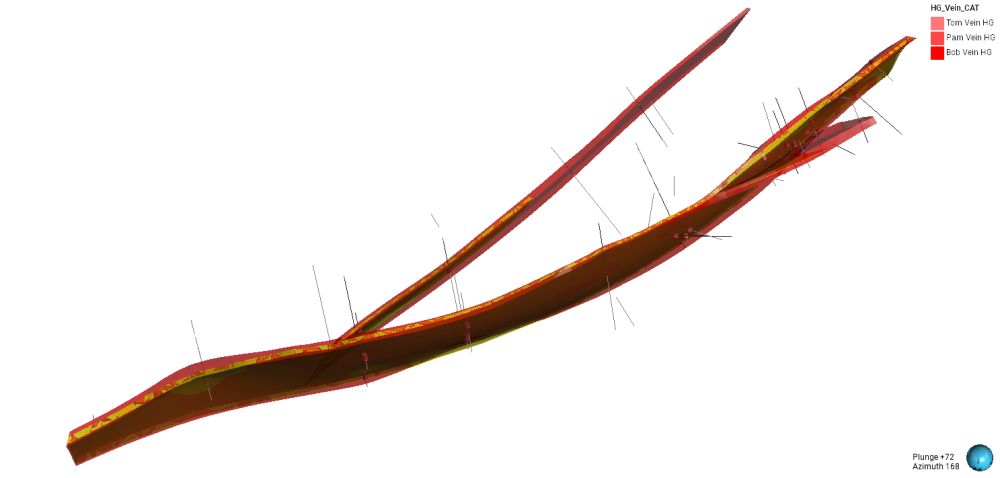
I started with category from numeric to assign Low (≤1) – Mid (≤5) – High (≤10) – Very High (≥10) Au values. From there, I did an interval selection from Mid to Very High to generate the veins, so instead of using the litho I used the assays to build the veins. I then created a vein system from that interval selection, where I assigned intervals for each vein based on the litho intervals to follow the same trends. Then I created another vein system to generate the high-grade nested veins using the boundaries of each vein, but in this case only with Very High values, then activating pinch-out and refining so that it looks geologically coherent.
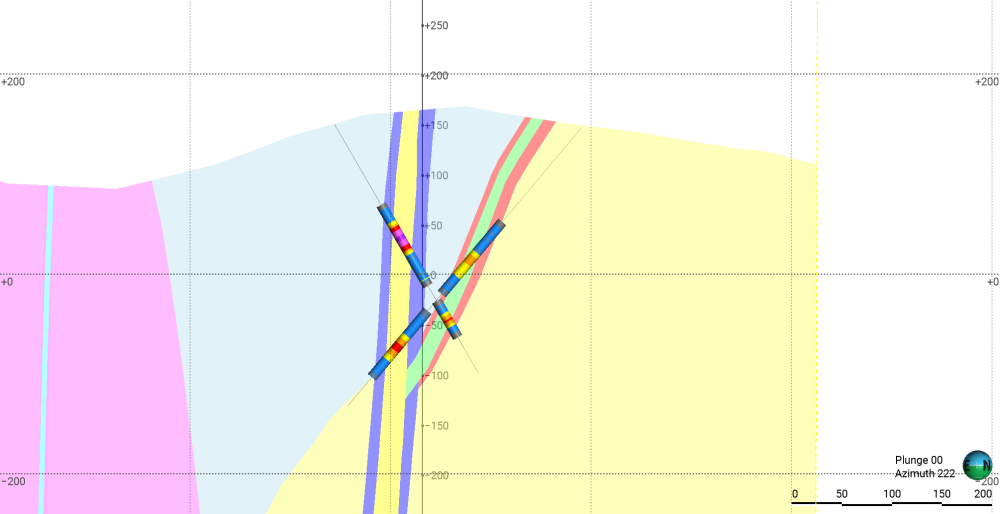
High Grade Veins are the yellow meshes, and the red ones are the "low" grade veins. Also I activated the High Values intervals (see legend). Obviously I could use other values for the intervals and the secondary high grade veins would look more continuous but I prefer to use the Very High ≥10 Au values.Thanks for the webinar @ErikScheel, now I want to try the second and third workflow that you showed.
 2
2 -
Hi @ErikScheel!
Im currently working on a project generating higher-grade discontinuous veins within low-grade veins. Something that really helped me respect the geometry of the larger vein is: Extract Vertices from each low-grade vein, generate a mesh from those points, and use that as a reference surface. By doing that, the high-grade vein respects the limits and geometry of the larger one. I also enabled pinch-out since they are not continuous. Have you tried that? What do you think?"
Cheers,
Nicolás1 -
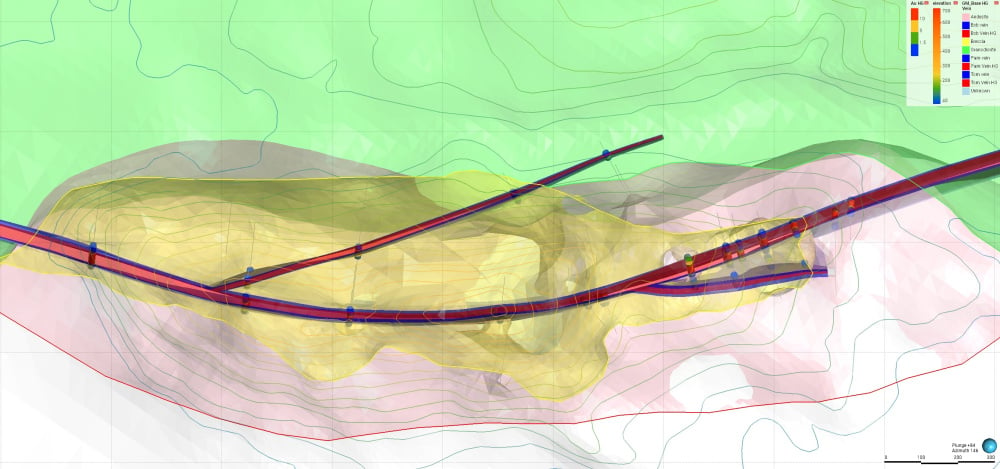
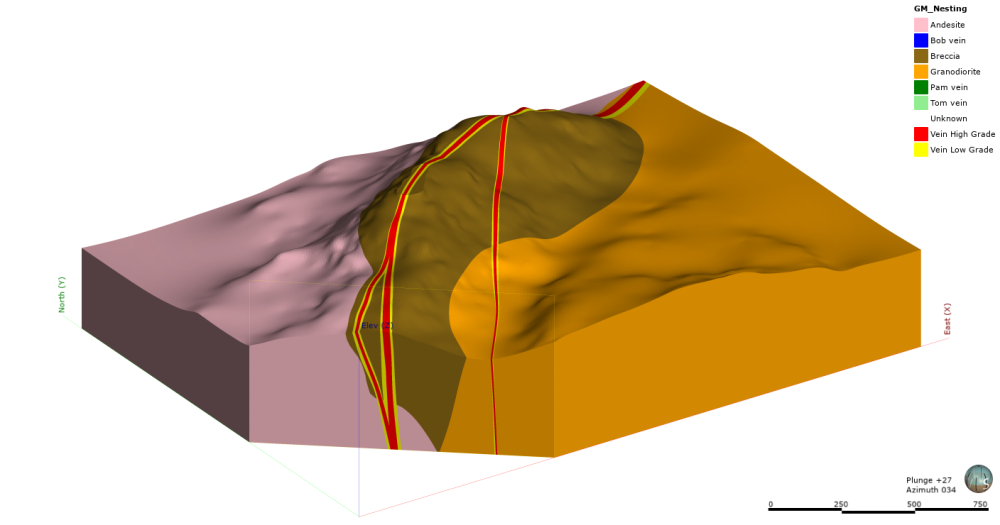
Nesting is where my comfort level currently lies, but this was a good opportunity to practice the refined model workflow. I’ll be trying the offset workflow at a later date as well. The first step was to create topography, snap contacts and DDH data to surface. The workflow used to segregate the Au break was fairly consistent with the methods presented. A lithological model was created recognizing the parent vein system (Tom, Pam, and Bob), with FW and HW contacts adjusted where applicable. Minor refinements were required for the reference planes. Midpoint mesh for the Tom vein and applying a structural trend via a fault system to the Bob vein, which allowed for a cleaner termination along the Tom vein. Output volumes were generated from the parent veins, after which Au values were applied and filtered within those volumes. Interval selection was then used to define HG vein domains. A new HG vein system was added to the existing geological model, and chronology was set such that the HG veins are younger than the parent vein system, producing the final model. The workflow was then re-run using the refined model approach. This was more time-consuming, although my limited experience with this workflow was likely a contributing factor. Overall, I enjoyed the session and am looking forward to the next one!
 1
1 -
Hi Erik and Seequent Teams. Unfortunately, i missed the session. Any recording or on demand video? Thank You
0 -
@Nrodriguezoria Thank you for posting! Regarding your comment about using vertices, I generally avoid doing that as vertices are static, so if there are any changes to your veins from new drilling, channel samples etc. you would then need to extract the vertices again, make another reference surface, and then manually swap it into your high grade veins. There is a feature request to make vertices dynamic, but don't know if/when it will get worked on.
1 -
@GarrettHooey Thank you for posting! I like that you mixed it up by using a structural trend. Pro-tip: if you want to have another layer of nesting (e.g. LG, MG, HG) you could use the nesting workflow to define the LG-MG system, then refine the MG system to make the HG veins.
1 -
@RAhmadFauzanWiraprad if you signed up for the webinar you will receive a link for the recording.
1 -
Summary of Workflow
Data was imported and checked.
A merged table was created combining Au and lithology data.
Drillholes were visualised, and an interval selection was generated using univariate statistics as a filtering method. This was used to group the data into six domains: bob_hg, bob_lg, pam_hg, pam_lg, tom_hg, and tom_lg.
A new geological model was developed using the interval-selected data. The six domains were modelled using a vein-system approach.
The domains bob_hg, bob_lg, pam_hg, and pam_lg were constrained within a polyline to produce the final visualised result. I have to work on the pam_lg domain midpoints to follow the orientation.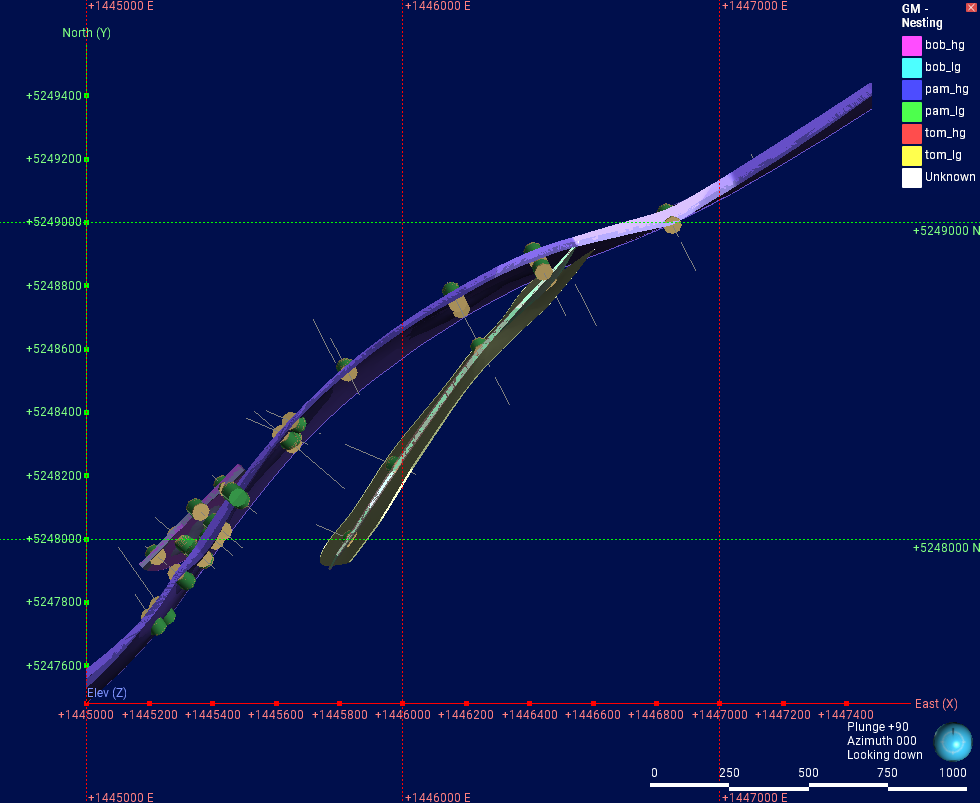 0
0 -
These workflows have made me so happy. For highgrade cores I have been doing the traditional wireframing route rather than using leapfrog - this has made my life exponentially better. Thank you so much Erik for you time!
P.S. I used workflow 1 and used the histogram on each vein for interval selection (which I also didn't know you could do and is a game changer).
 1
1 -
great work!
0 -
where is the dataset?
0 -
Thanks for posting @HudsonBrewBoahene! To get the Pam vein to properly cross over the Tom vein, you need to edit the reference surface using explicit edits (polypoints or polyines).
1 -
Hi @SarahKynaston I'm glad you've found these useful! As for the interactive charts, the scatter plot is also interactive, so if you're looking to isolate e.g. data with high Au and Ag, plot them against each other and circle the points on the graph to see them in the scene.
Traditional explicitly modeled wireframes are all well and good until you add more drill data: I worked on a project where our biggest deposit was infilled from 50x50 to 25x25 and the entire explicit model needed to be remade from scratch 😐️1 -
@KhalidSalim the link is in the description (mouse over Veins Project)
2 -
I really like the nesting workflow because it’s faster and produces quite satisfactory results. To achieve optimal results, be sure to add vein midpoints or meshes to the reference surface and exclude any hanging wall and foot wall intervals that don’t match.
 1
1 -
@Nrodriguezoria @GarrettHooey @HudsonBrewBoahene @SarahKynaston @RAhmadFauzanWiraprad 👏🏼 thank you so much for taking the time to share your models! One of the things we never get sick of is how the outputs of the same dataset can look so different based on the creator.
I've sent you each a reward pack redemption link so please check your inboxes for those. We hope to see you at the next session!2