Displaying grid files on screen - problem with context manager


Any comments why image does not show up by using context manager (Case 1) but does show when not using context manager (Case 2)? I would prefer using context manager as it prevents errors where context has been already created and basically you have to comment out line gxp = gxgx.GXpy() in order to be able to run code anew. Or is there a way to test whether context has been created?
Case 1. Using context manager for GXpy: no image shows (but I can see in C:\Users\username\AppData\Local\Temp\GeosoftTemp that there is a new folder which actually contains that image as png file)
import geosoft.gxpy.grid as gxgrid
import geosoft.gxpy.gx as gxgx
from IPython.display import Image
with gxgx.GXpy() as gxp:
image_file = gxgrid.Grid.open('mag_data_mag.grd').image_file(shade=True, pix_width=500)
Image(image_file)
Case 2. Using no context manager for GXpy: image shows
import geosoft.gxpy.grid as gxgrid
import geosoft.gxpy.gx as gxgx
from IPython.display import Image
gxp = gxgx.GXpy()
image_file = gxgrid.Grid.open('mag_data_mag.grd').image_file(shade=True, pix_width=500)
Image(image_file)
Answers
-
hi Petri. If you want to use the python with statement for context managers (https://www.geeksforgeeks.org/python/with-statement-in-python/) you need all gx developer python code to be in the indented scope like so:
with gxgx.GXpy() as gxp
#gx developer python code goes here
image_file = gxgrid.Grid.open('mag_data_mag.grd').image_file(shade=True, pix_width=500)
Image(image_file)
#gxp is now out of scope and wont work
print("hello")1 -
As you can see in your own post (or at least as it shows to me), this forum does not obey tabs or seemingly other white space in the beginnign of lines. Of course I know how context manager works…
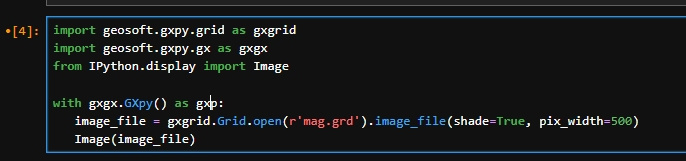
My question is why does not this code open the grid in Jupyter notebook? This time I include code as image here. The cell is run but no image is shown.
 0
0 -
I'm unable to reproduce this issue. Its able to show me grids in both case.
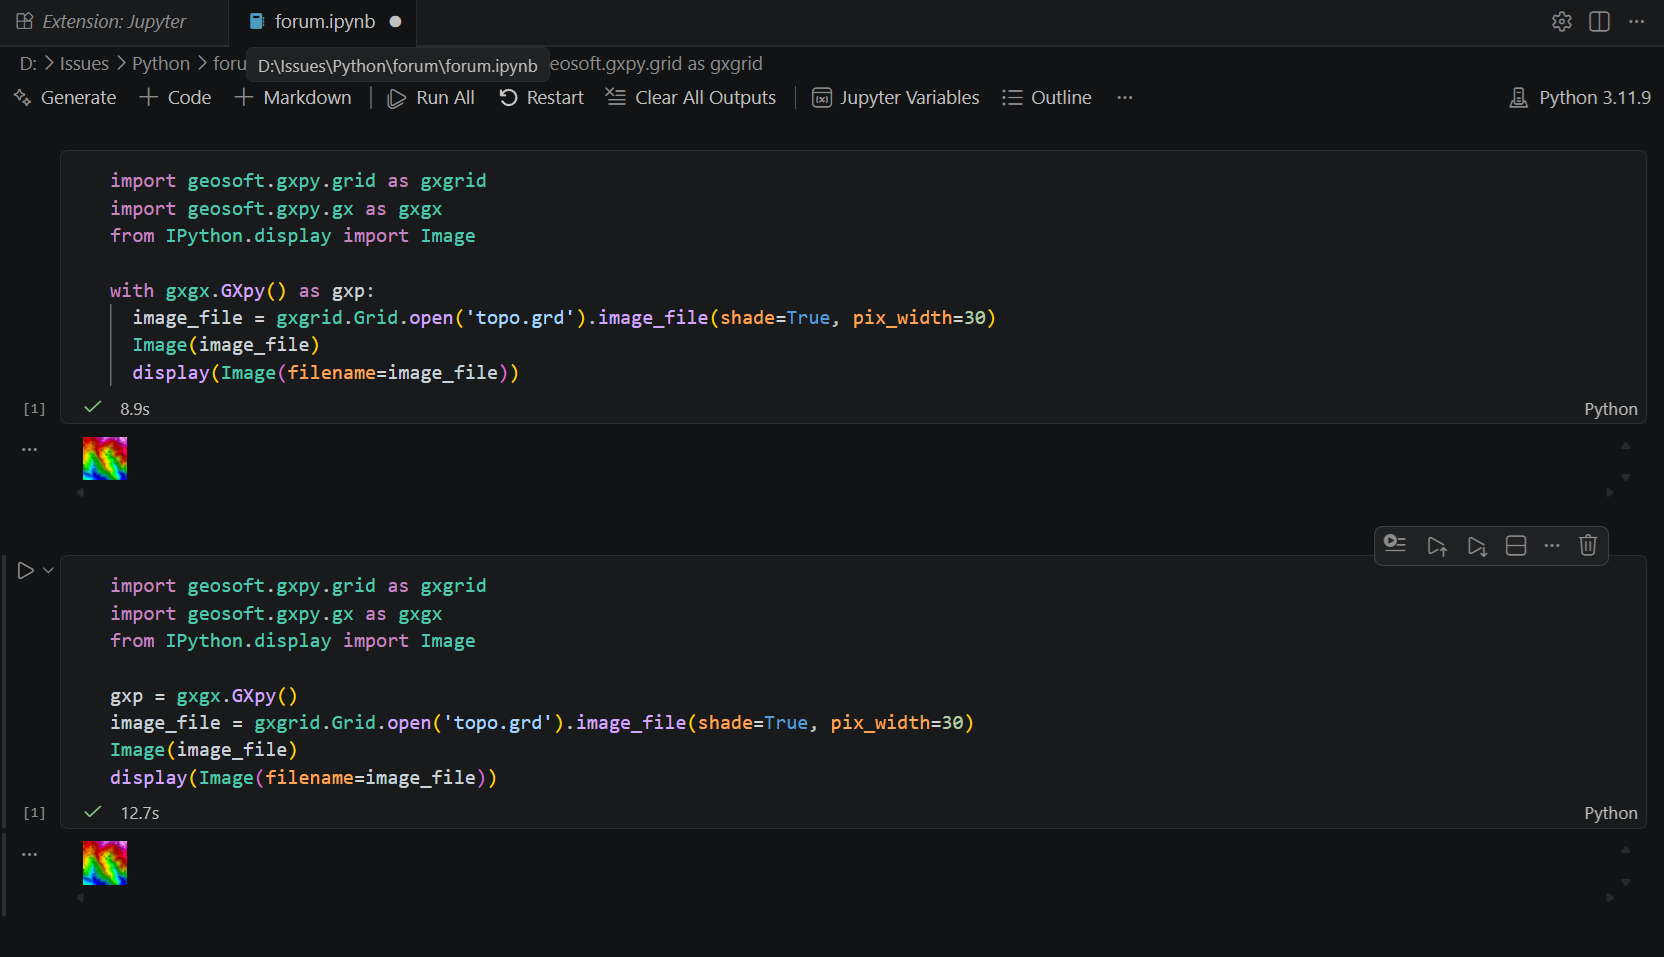
It will give you a "A GXpy instance has already been created for current thread." error if you try to run either cell after running the second example ( gxp = gxpy.GXpy() ) because the context is never disposed. If this is the issue that you're having you need to manually dispose the context
gxp.__exit__(None, None, None)1 -
Thanx SerbanMarin1!
It seems that your last line does the trick: display(Image(filename=image_file)) when using first piece of code. Image does not show up without that line:
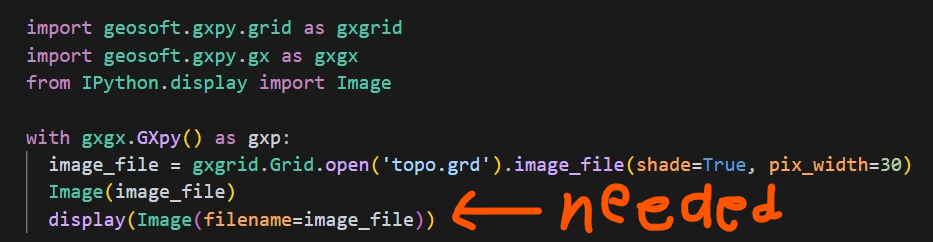
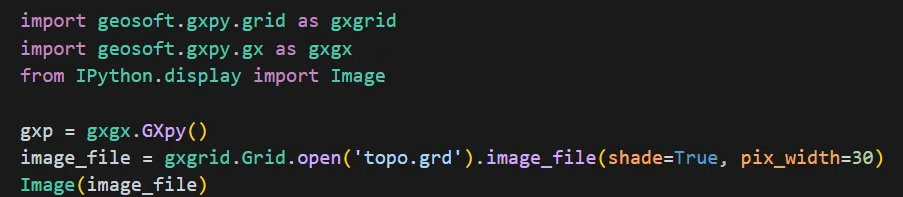
However, it is not needed when you don't use context manager, so even this code below shows up the image:
I wonder if there is something to learn here or I just have to take as it is.
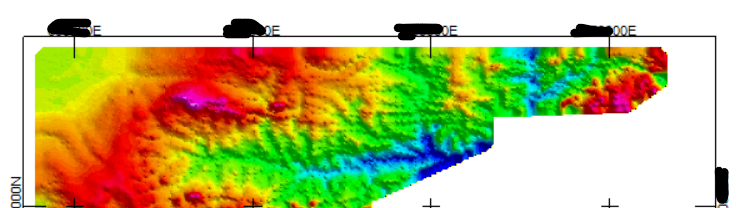
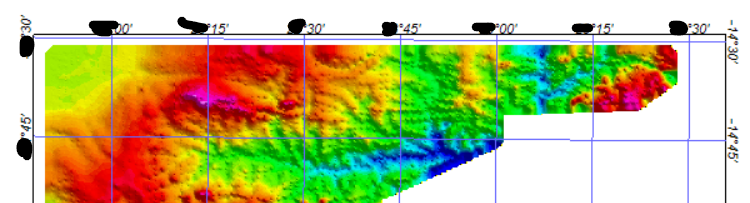
Would you be able to give me also some hints what options are available through features option in gxgrid.figure_map('grid.grd', features= …)? I am able to include geographical grid (with longitudes and latitudes) on map with following lines:image_file = gxgrid.figure_map(r'mag.grd', features=('NEATLINE', 'SCALE', 'LEGEND', 'ANNOT_LL')).image_file(pix_width=500)
Image(image_file)
display(Image(filename=image_file))
But what if I wanted to use projected coordinates instead on grid? I mean Easting and Northing values in meters (ETRF TM35 FIN for example, grid file already has this coordinate system). Is this something that I can easily just change in features options somehow?
0 -
-
Regarding the "display" command. I made a mistake in my post. Image(image_file) can just be replaced with
display(Image(filename=image_file)). For me, it only shows up if I use "display" but I'm using the jupyter notebook in VSCode, perhaps the engine you're using is different and infers the display command.
Regarding "figure_map" this method may be too limited for your map requirements. You can see the implementation below (notice the call stack goes down to the figure_map in agg.py):https://github.com/GeosoftInc/gxpy/blob/b01b7db309f7f0d7fbc7ed02e21309f11052f2b8/geosoft/gxpy/agg.py#L357
1

Categories
- All Categories
- Community
- 16 Latest Releases
- 15 Member Spotlight
- 38 Learning
- Products
- Geology
- 535 Leapfrog
- 1 Volsung
- 25 Visible Geology
- Data Management & Collaboration
- 14 MX Deposit
- 13 Central
- 9 Imago
- Geotechnical
- 136 GeoStudio
- Geophysics
- 319 Oasis montaj
- 1 Workbench
- SPIA
- 9 Res2DInv & Res3DInv
- 3 Evo
- 25 GX Developer