About how to correct the red “X” symbols in GeoStudio software.

Hello everyone, I hope you are all doing well and staying healthy. I have a question regarding how to correct the red “X” symbols in GeoStudio software.
Question Regarding Red X Marks and Gray Circles in GeoStudio SEEP/W
What do the red "X" marks and gray circles represent in GeoStudio? What is the proper method to remove or correct them?
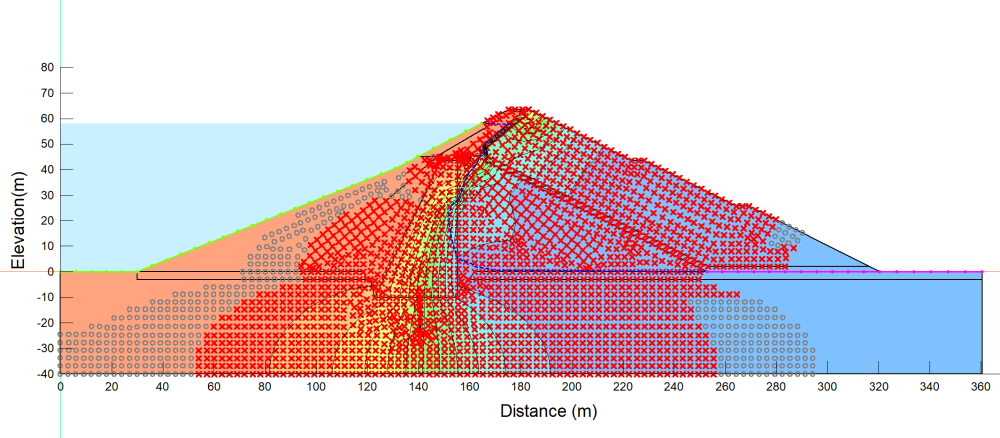
I have been working on an earth dam raising project for a long time, and I am currently analyzing the raised dam using GeoStudio SEEP/W. After running the seepage analysis, a large number of red X marks and other symbols appear on the model geometry.
The analysis itself does not show any warning or error message, but these red symbols remain visible on the model after the SEEP/W analysis.
Could you please explain:
- What do the red X marks represent?
- What do the gray circles represent?
- Do these symbols indicate a modeling, mesh, material, boundary-condition, or analysis problem?
- Why do they appear after completing the seepage analysis?
- What is the correct procedure in GeoStudio to remove these symbols or correct the underlying problem, if there is one?
I have already checked the material properties, boundary conditions, and analysis settings, but the red symbols are still appearing. I would appreciate a clear, step-by-step solution for identifying the cause and eliminating these symbols from the model.
Comments
-
The red “X” marks and gray circles in GeoStudio are convergence indicators displayed at nodes in the finite element mesh. They can be displayed in Results View using the Node Convergence option and help identify nodes that did not satisfy the specified convergence criteria.
What the symbols represent:
- Gray circles These indicators may be displayed at nodes when the difference between the independent variable (pressure head, temperature …) reported at two successive iterations is larger than a specified tolerance.
- Red X These indicators may be displayed at nodes when the maximum difference criterion discussed above has not been met and the independent variable (pressure head, temperature …) reported at two successive iterations is smaller than the specified significant digit criterion.
The Maximum Difference criterion is particularly useful when the calculated values are very small. Two very small values may fail the Significant Figures criterion even though their absolute difference is negligible from an engineering perspective. In this case, the Maximum Difference criterion can still classify the node as converged.
Why they appear:
These symbols indicate that the convergence criteria were not fully satisfied at those nodes during the iterative solution. This can occur in numerically challenging analyses, particularly when material properties are highly nonlinear.
For example, in an unsaturated seepage analysis, hydraulic conductivity can vary by several orders of magnitude over a relatively small range of pore-water pressure. This strong nonlinearity can cause the iterative solution to oscillate or converge slowly.
Corrective procedure:
- Check the convergence settings. Review the Significant Figures and Maximum Difference criteria defined for the analysis. The convergence criteria should be appropriate for the scale and objectives of the model.
- Review the under-relaxation settings. For highly nonlinear problems, under-relaxation can help control large changes in material properties between successive iterations and produce a more stable progression toward convergence. GeoStudio documentation gives examples such as reducing the Initial Rate from 1 to 0.65 and, if necessary, reducing the Minimum Rate from 0.1 to 0.01. These values are examples rather than universal recommended settings.
- Verify convergence rather than relying only on the symbols. The presence of a small number of unconverged nodes does not automatically mean that the entire analysis is invalid. The location and magnitude of the convergence issues should be evaluated together with the overall behavior of the solution.
- Once the convergence behavior has been evaluated, the Node Convergence display can be turned off in Results View if the symbols are no longer needed for interpretation.
You will find some more details and examples in the link bellow:
Kind regards,
Seequent team
2 -
Hi @sayednesarahmadomid, in addition to Amanda's information above, here's a webinar that talks in depth about convergence: Mastering SEEPW Analysis: Interrogating Seepage Results and Dealing with Convergence Issues
1


Categories
- All Categories
- 288 Community
- 3 Get Started
- 16 Latest Releases
- 16 Member Spotlight
- 42 Learning
- 1.1K Products
- 565 Geology
- 538 Leapfrog
- 1 Volsung
- 26 Visible Geology
- 36 Data Management & Collaboration
- 14 MX Deposit
- 13 Central
- 9 Imago
- 136 Geotechnical
- 136 GeoStudio
- 332 Geophysics
- 321 Oasis montaj
- 1 Workbench
- SPIA
- 10 Res2DInv & Res3DInv
- 3 Evo
- 27 GX Developer