Getting 33rd and 66th percentiles on the table of statistics


There is a good tool to provide data statistics within Leapfrog.
It provides the following:
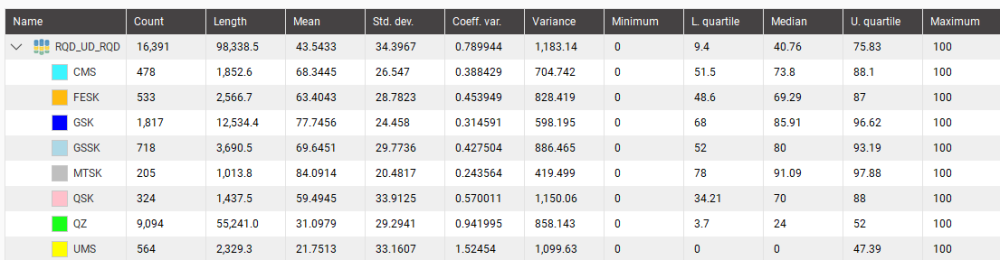
Count, Length, Mean, Std. Dev., Coeff.Var., Minimum, L. quartile, Median, U.Quartile, Maximum
The L. quartile corresponds to the 25th percentile., the median to the 50th percentile and the U. quartile corresponds to the 75th percentile.
It there a way to include the 33rd and 66th percentiles? I would imagine that since the logic of the calculation for the other percentiles is there. It should be pretty easy to inlcude this other percentiles.
Below is a screen shot of the current table of statistics.
Answers
-
Hi @JofreeDuran Thanks for the suggestion we will add it to our system for review by our product development team.
1 -
Thanks Carly, I hope it is implemented as it would be a quick win
1

Categories
- All Categories
- 302 Community
- 3 Get Started
- 17 Latest Releases
- 16 Member Spotlight
- 42 Learning
- 1.1K Products
- 565 Geology
- 538 Leapfrog
- 1 Volsung
- 26 Visible Geology
- 36 Data Management & Collaboration
- 14 MX Deposit
- 13 Central
- 9 Imago
- 137 Geotechnical
- 137 GeoStudio
- 332 Geophysics
- 321 Oasis montaj
- 1 Workbench
- SPIA
- 10 Res2DInv & Res3DInv
- 3 Evo
- 27 GX Developer