Structural trend challenge: Put your learnings into practice!

OK, like any good teacher/instructor I'll give you some homework or a simple task for you to test out if you know (or will have learned) anything from tomorrows Mastery session on Structural trends…
We will (would) have covered how to create your structural trends for more connected shapes and possibly more geological accurate shapes even? So here is your mission if you chose to accept it.
Here’s how you can participate in the challenge:
- Get the demo data: Download it here:
- Create a project in Leapfrog Geo
- Create your structural trend: Use the steps I’ll take you through on the session as a guide, or follow the steps on the online Structural modelling course:
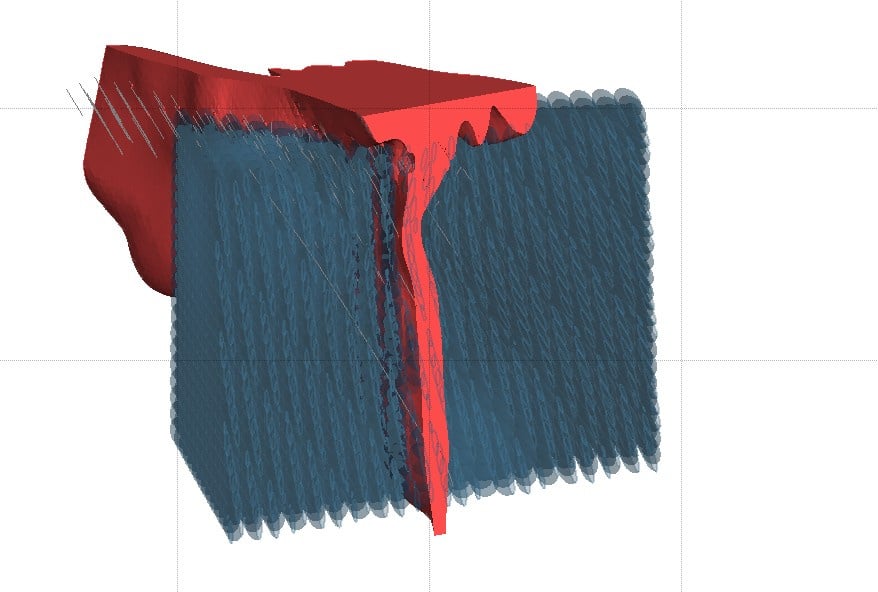
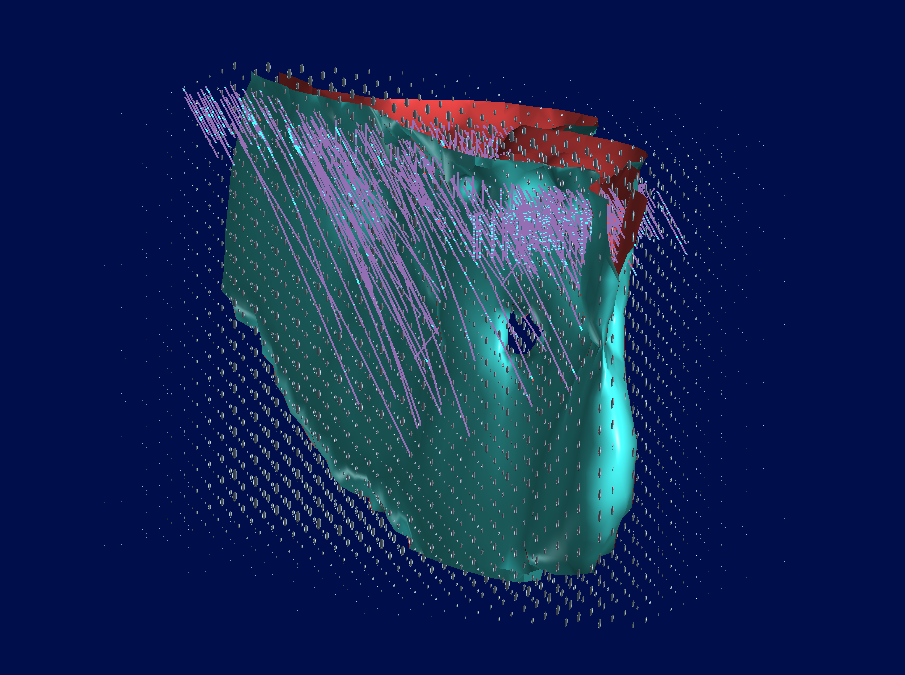
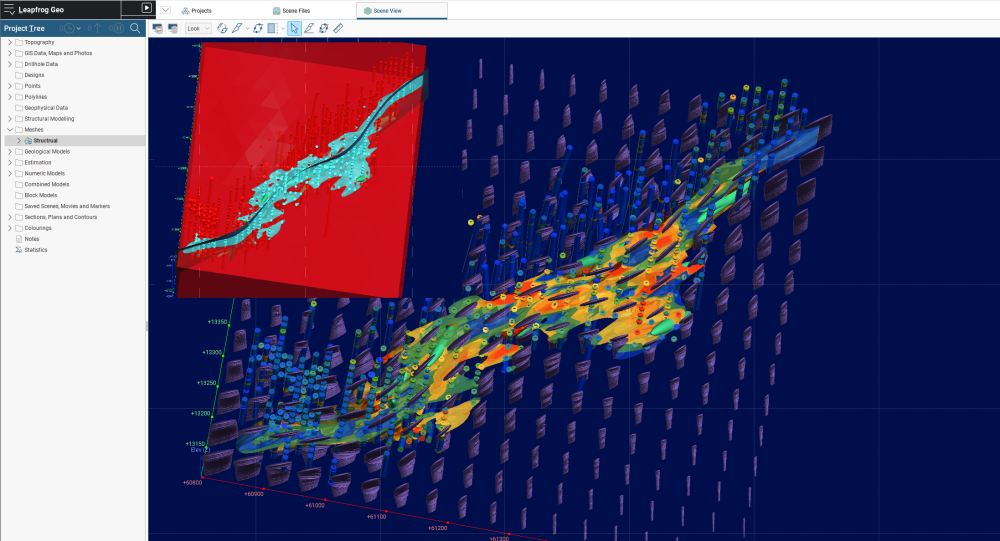
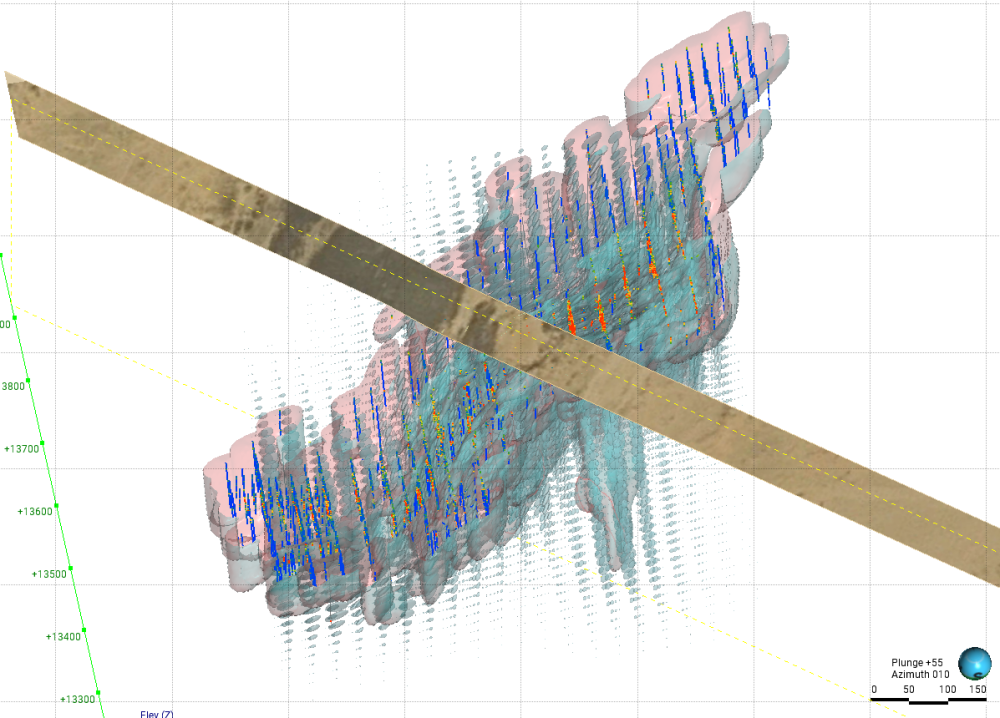
- Share your work: Post a screenshot of your work in the comments on this post!
We have some awesome Seequent merchandise packs up for grabs for the first 20 structural trends posted.
Also, extra digital cred for spotting the pop culture reference (that I thought about)..
Try everything, fail fast and continue forward. Happy modelling!
Comments
-
 3
3 -
 3
3 -
 2
2 -
 3
3 -
 3
3 -
 2
2 -
How can I get the training demo license. Please anyone can help me.
Yedidia Mgema
Senior Resource Geologist0 -
Hi Niklas Sääv,
Thank you for putting together such an engaging and motivating challenge! I really appreciate the clear guidance and the opportunity to practice structural trends in Leapfrog Geo.
3 -
Is there a copy of the recording for those who missed the live session?
0 -
Hi @PamKoi - you can catch up on the session here:
3 -
 1
1 -
Thanks Niklas for a nice training! I'll have a go at our real data next week, too, and see if that can produce anything decent or if it'll just be a bunch of Accidental Leapfrog Art 😅
 2
2 -
@PhamVietThai no worries! I'll shout out @StephanieSchweighard for keeping the challenge to a decent level… I was way more ambitious with the expected results… maybe another time ;)
@AlexvonSchéele ALA is the best kind of art :D
The only way is forward!1 -
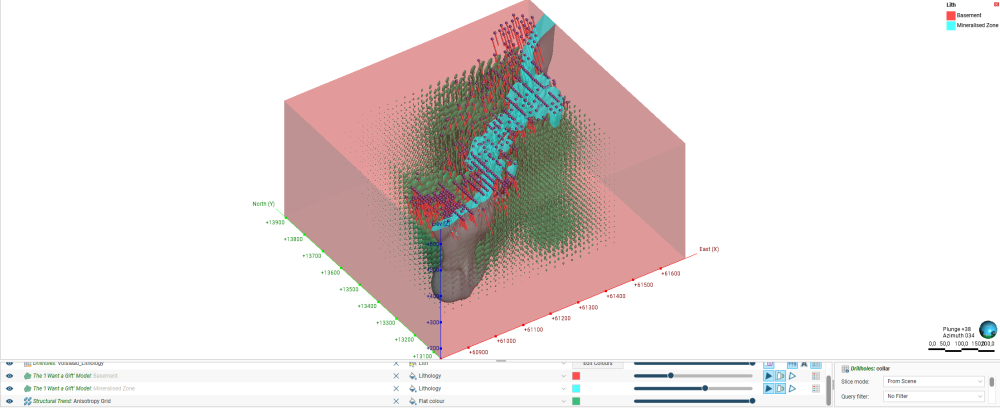
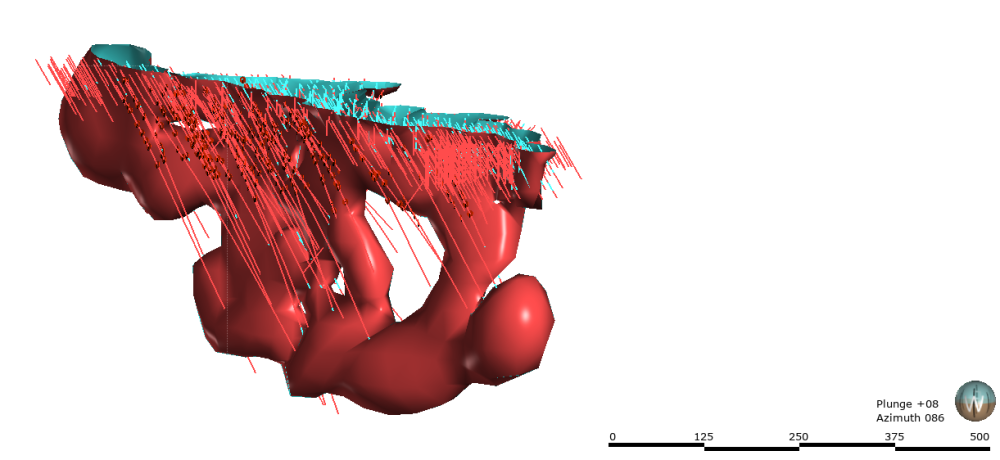
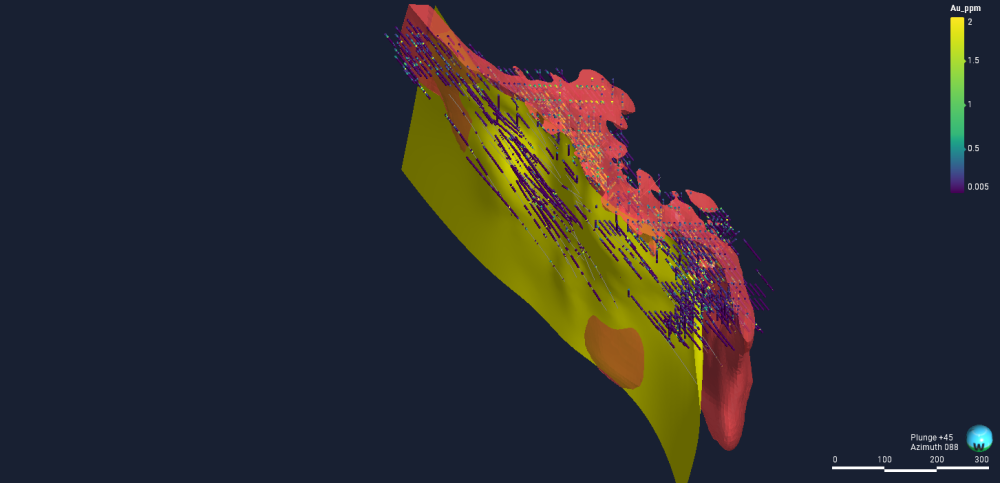
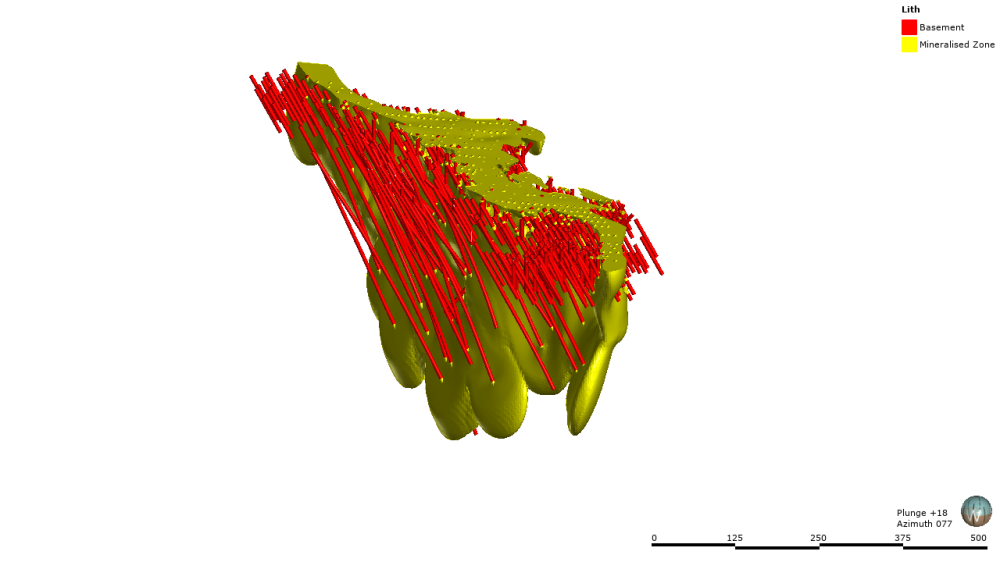
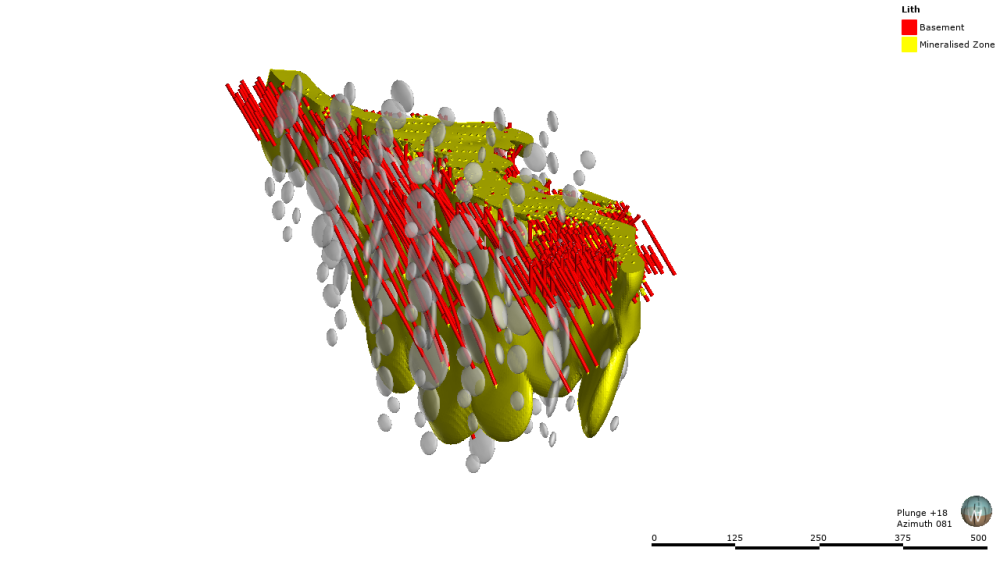
Thanks for the class @NiklasSääv, I spent some time working with the dataset and started by running basic statistics on the Au assays. Then I converted the numeric values into categories (Very Low to Very High), using statistically defined ranges after QAQC filtering of non-positive values. to simplify the interpretation and better “connect the dots. ”
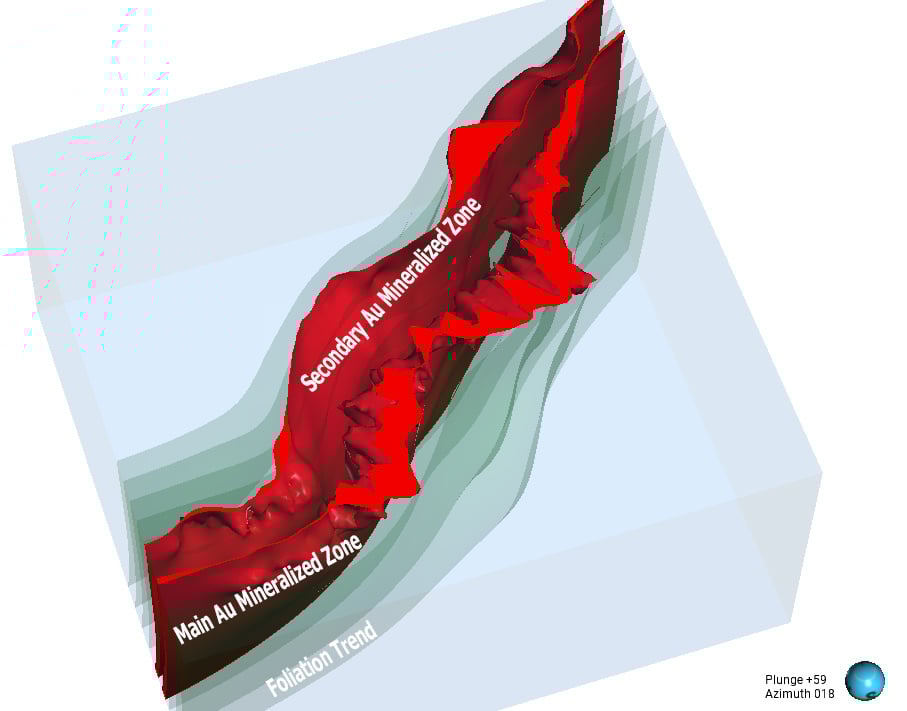
During this process, I identified what could be a secondary Au zone trending similarly to the main zone toward the NW. To model this I applied interval selections based on the categorized Au values.
From there, I defined two main domains: a Main Vein Zone and a Secondary (lower grade also) Vein Zone. Using these, I generated two Au vein interpretations and assigned different foliation trends based on the FI values (e.g., FI 0, FI -0.25, etc.). I also made minor adjustments to the hanging wall (HW) and footwall (FW) to improve the overall geometry and avoid excessive noise.
This is a quick conceptual model (done in under an hour), so it’s not highly detailed haha I’m aware that the secondary mineralized zone may be somewhat exaggerated, but it serves to illustrate the interpretation.
Cheers from Chile,Nicolás
 1
1 -
 3
3 -
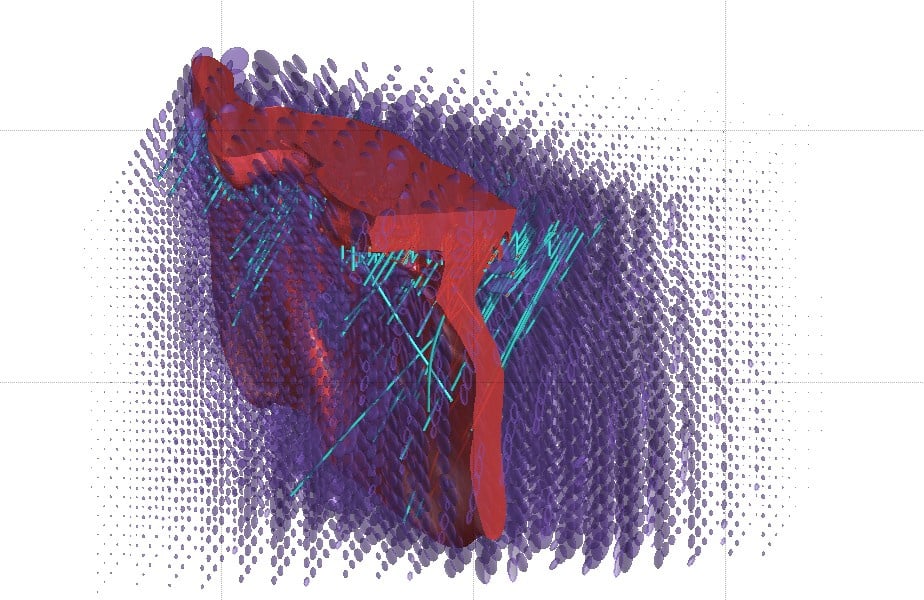
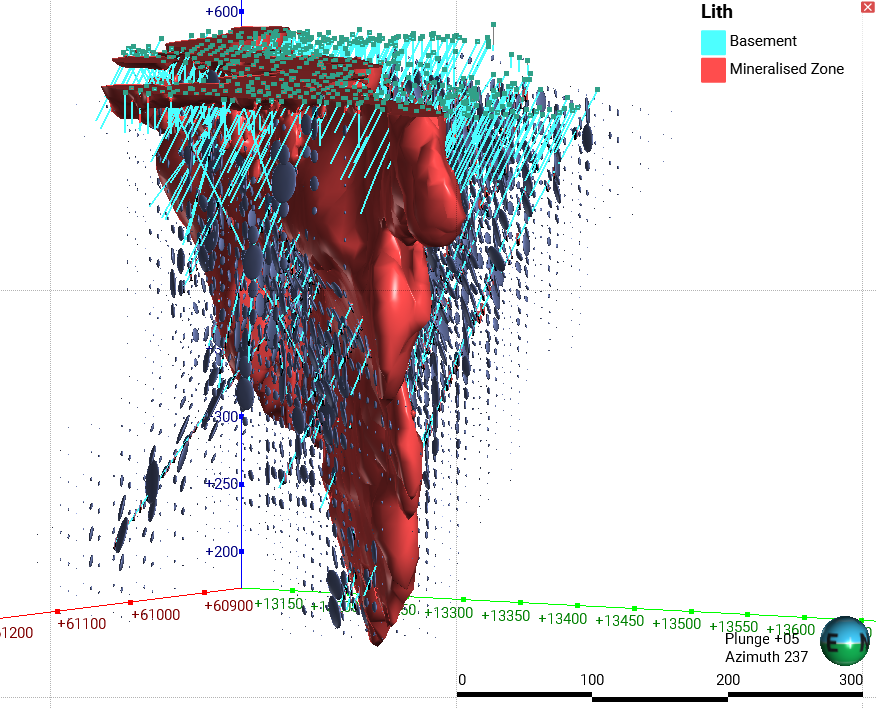
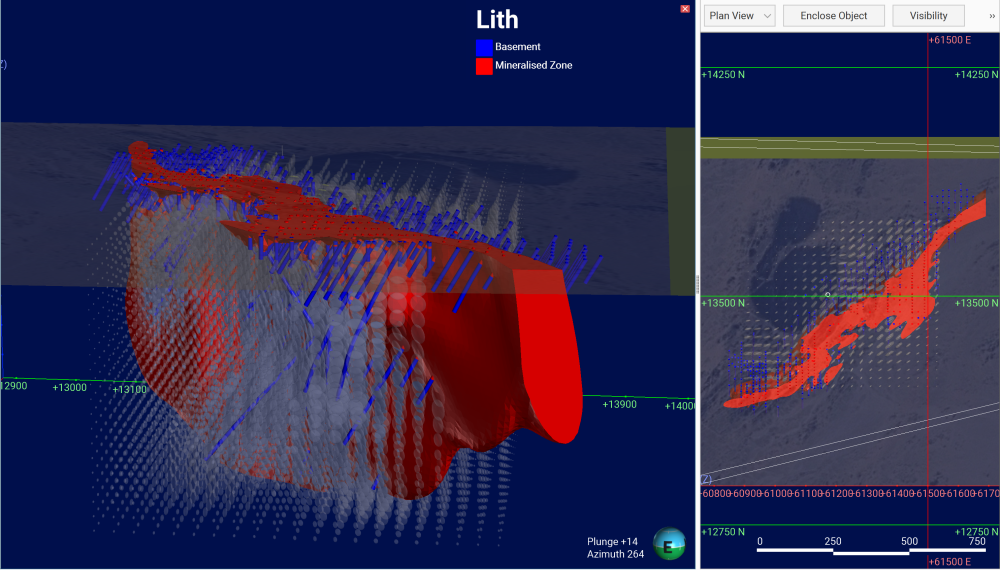
Great session! Many thanks to @NiklasSääv and @HollyChapman for the insights. I’ve attached my work for the challenge, would be very grateful if you could provide some feedback or suggestions on my results. Can't wait for session 3!
 1
1