Visualizing ground inclinometer data (horizontal displacement & azimuth)


Dear LP community,
recently working on a tunnelling project, we need to visualize ground inclinometer's data directly on a 3D model. I know that inclinometric ground horizontal displacements can be uploaded as "numeric data" when importing boreholes (i.e. you can attach horizontal displacements and direction of displacement - azimuth - together with the rest of BH data). It would be good if these data could be visualized as a bar graph (similarly to an SPT graph), but taking into account both the magnitude (displacement) and the azimuth (direction of displacement). Similarly to the attached graphic (IA generated).
Could it be added as a new functionality in future upgrades?
Many thanks!

Comments
-
Hey @OriolGelizo, a few potential ways you may be able to visualize this data within LF, But none will be directly related to a directional bar graph around a boring as you showed.
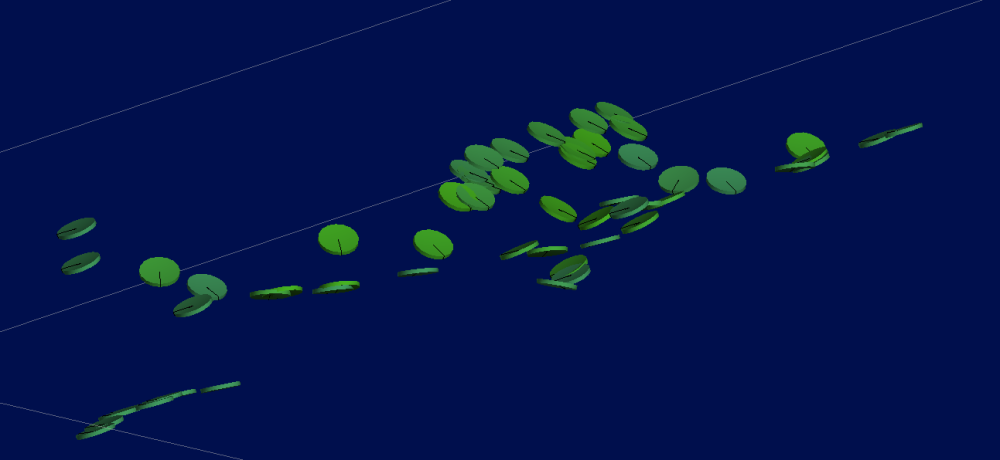
Dependent on the data being used and the format will change how to handle this data and visualization. I can image if you get the data as points, a good option could be to then create structural disks that can be visualized in the scene to show dip and azimuth direction. Alternatively, you can export and re import these points to show structural lineations, which can show directions.
Alternatively, if you make a mesh from the points, and then extract the points from it, you can then make structural data outputs (disks or lineations) to visualize the direction as well.
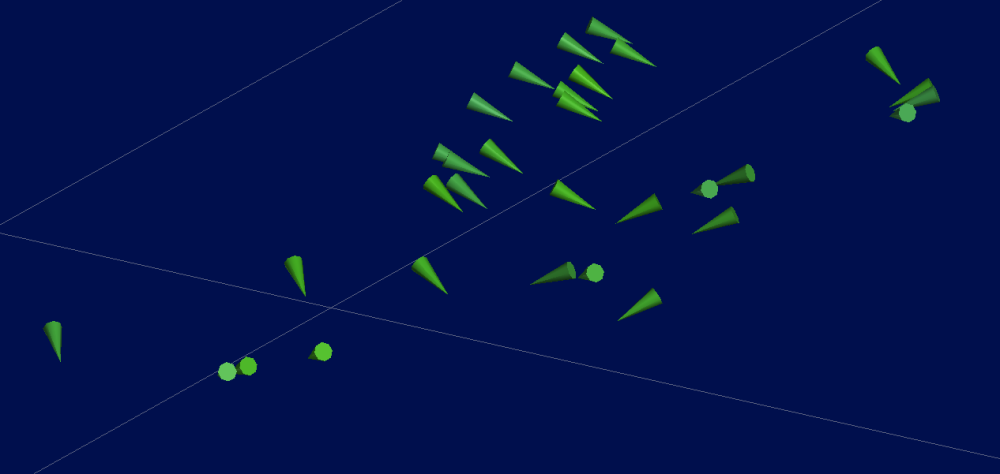
Example of structural disk or lineations arrow outputs here:
I would be interested in taking a look at the data to try and create some outputs with you!
3 -
Hi Lucas,
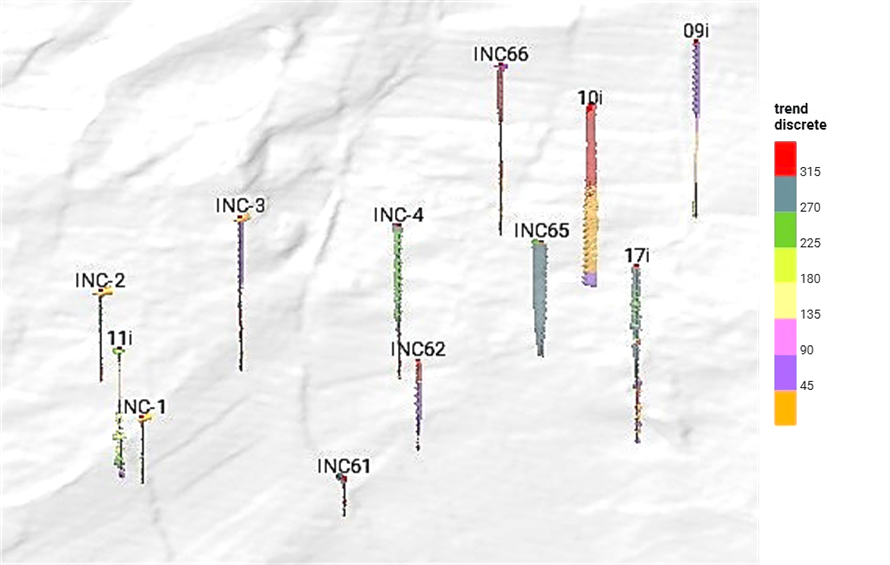
thanks for your help. As you mentioned, I've imported inclinometric data as structural lineations. Direction of displacement has been imported as "Trend" column, while "Plunge" data has been set to 0 (to visualize horizontal cones). Displacement values have been imported in a new column as Numeric values (i.e. horizontal displ. in mm). After that, I've applied discrete values to "Trend" to visualize azimuth values according to 8 sectors of the 360º wind rose. The size and length of the cone is related to the "Horizontal displ. in mm" column values, so as to show the magnitude of the ground movements (see attached image - sorry for the bad quality!).
This is a good approach to represent inclinometric data in a 3D view, but it would be better to have other options to display vector data in a model (as long as in a 2D view, e.g., a cross section).
 0
0
