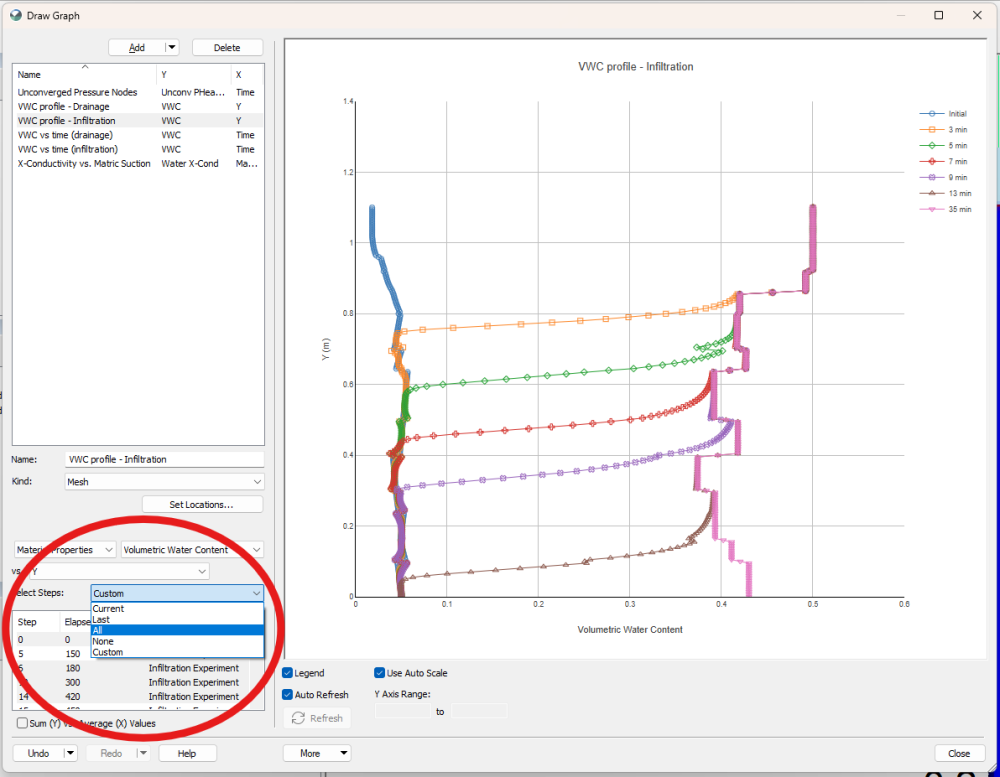
How to plot the data with steps

ShishirKumarSikderAm
Posts: 4
in GeoStudio
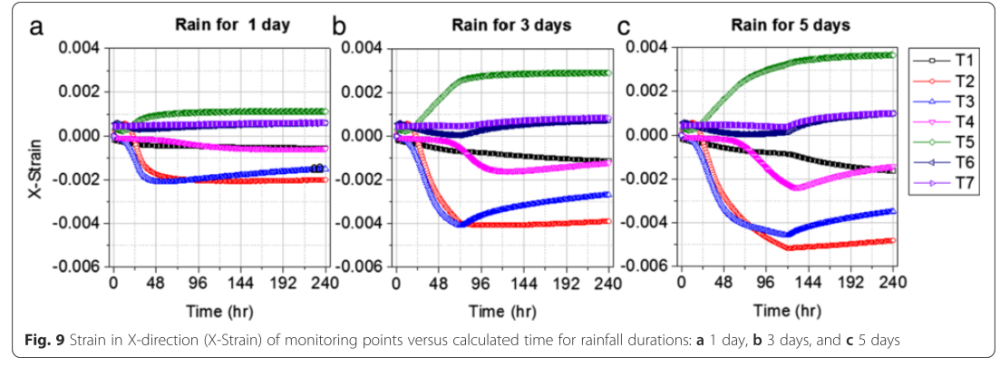
In this study, results of slope conditions were calculated for 240 different steps under each rainfall condition. I do understand that I can define no of steps in define project option. Can you please tell me how to plot the data with steps?
0
Answers
-
Hi @ShishirKumarSikderAm, when you're in the Draw Graph dialog, you can click on the Select Steps dropdown and select the option you want, which includes All. If you only want to plot certain steps, then you can click Custom then select the steps in the box below. I hope this helps.
 2
2 -
Thank you so much, Sir.
1

