Grout Fill Tracking in Diamond Drill Holes


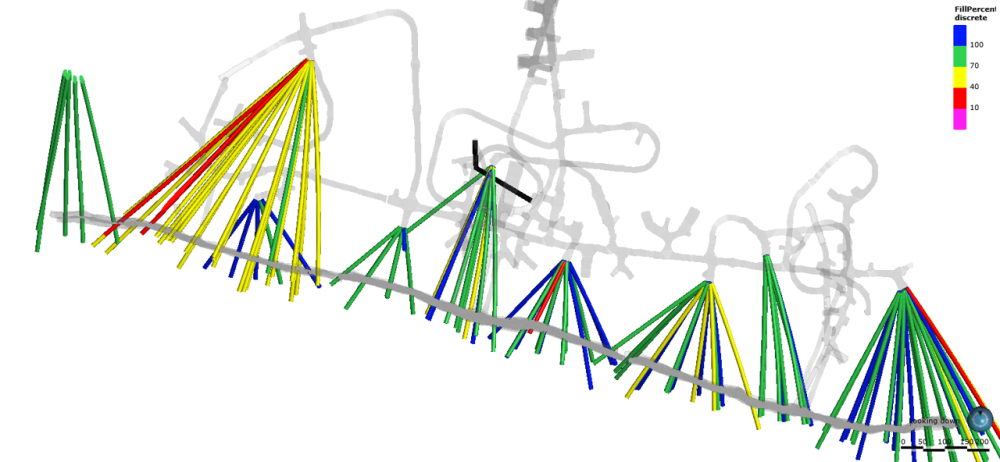
Thought I'd share a quick trick that helped visualize the risk of historic underground diamond drill holes that weren't grouted to standard. A csv file was created with the hole ID, from & to, and fill percentage (calculated by total bags of grout/(NQ hole diameter x length of hole x bag fill factor) as an interval table applied to the diamond drilling database. When plotted in 3D, it became a very easy and visual way to identify holes or areas that were not filled to standard, including where they were collared and what drifts they might pass through. Then a custom color scheme was applied to make the traces easy to understand and found this was very helpful when planning stopes and identifying hazards. This way holes that were not grouted to standard could be tracked down and plugged to eliminate the hazards of an open hole. (all sub-standard holes in this image were properly managed for safety hazards). This was easy to update and keep current, and easy to share in presentations and meetings. Hope this helps!
Comments
-
Thanks for sharing, @BenHenderson! This is a great tip
0
