Colour collar by different groups

Hi All, I'm looking to display the collar of boreholes based on different group/categories, —for example, based on the lithologies encountered at the end of each borehole or whether ore was intercepted. This would help me quickly visualize and understand the zoning of the ground. Is there a way to achieve this in Leapfrog? Thank you in advance for your help.
Best Answer
-
Hi James,
There's a couple of ways to approach this depending on what you're trying to categorise. Because the collar's refer to the entire hole, flagging one based on something like lithology at the end of the hole would require a level of manual work.
- The most direct is category selection on the collar table (Categorising Points). When you right click and pick that option, it bring's up a interval selection tool that you can highlight the collars and flag them to a new category.
- This can be combined with filtering, such as volume filtering (Filtering Data) for the meshes by using "select all visible points —> assign to category"
- If you are wanted to evaluate onto the collar solely based on where the collars themselves are located, related to meshes, you could also bring in the collars separately as the points file. Then evaluate GM's or Grouped Meshes with the evaluation tool (Evaluations) to quickly categorise those points. Though this is more limited without the volume filter option.
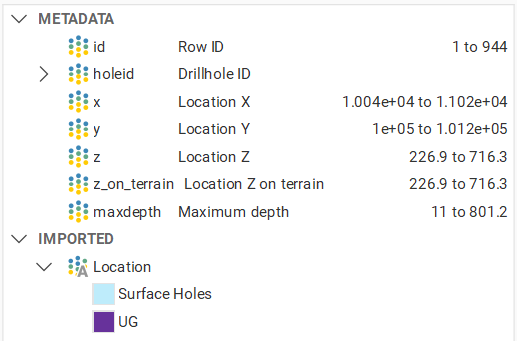
Also should be noted that the new LF version has the ability to create calculations on the Collar table, which isn't really helpful here, but does allow you to categories based on any of the available metadata within that table. For example:
Hope this helps you get the output you're aiming for!
Lee Evans
Project Geologist, Seequent, APAC
2 - The most direct is category selection on the collar table (Categorising Points). When you right click and pick that option, it bring's up a interval selection tool that you can highlight the collars and flag them to a new category.


Answers
-
Hi @JamesWAI were you able to figure this out in LF? Or are you still looking for insights into this?
0 -
Hi PrachiChitkara,
I don't have a valid solution yet. I think I can only separate the groups in excel and load them separately to leapfrog. I haven't tried it out yet.0 -
Hi LeeEvans, thank you for your insightful answer.
I think one of the way is to work with Points.
When creating the collar table, we can add a column for the category, e.g. lithologies encountered at EOH or GI Contractor etc.
Then import points and choose the selected classification as Category in Column Type. The points can then be displayed in different colour based on different categories. Legend can also be added to illustrate the colour categories.0 -
Hi James,
You don't necessarily need to export/import to points, as you can view the same colour scheme and legend directly on the collar table also. You just need to choose the 'Category Selection' on the collar table and assign them appropriately and the category will appear as a visual option in the drop down.
Cheers, Lee
Lee Evans
Project Geologist, Seequent, APAC
0 -
Hi Lee, I just tried and it works without exporting to points. Thank you!
1 -
Good to hear!
Happy modelling :)
Lee Evans
Project Geologist, Seequent, APAC
1
